Having worked with dozens of enterprise-level manufacturers, I can safely tell you that product quality and efficiency always matters. Whether they are bottling water, making diapers or packaging pizzas, efficient production is a persistent challenge for manufacturing organizations.
But it’s a challenge that can be solved by listening to machines.
In the consumer packaged goods industry, every bit of scrap represents a loss of time, raw material, and end product. Reducing this waste, while at the same time increasing overall production efficiency, is one-way plant managers can conserve resources while still meeting consumer demand. And I’ve seen how successfully scrap reduction can be achieved using machine health data.
Where Scrap is Happening
To implement a scrap-reduction plan, the first step is to predict where it’s likely to occur. You start by gathering data.
Unfortunately, mechanical vibration and temperature data don’t tell the whole story. To get a complete picture of what’s happening with the machines, and understand the underlying causes of product quality issues and scrap, you need to overlay the mechanical diagnostics with operational data like line speed, unit size, pressure changes, and so on.
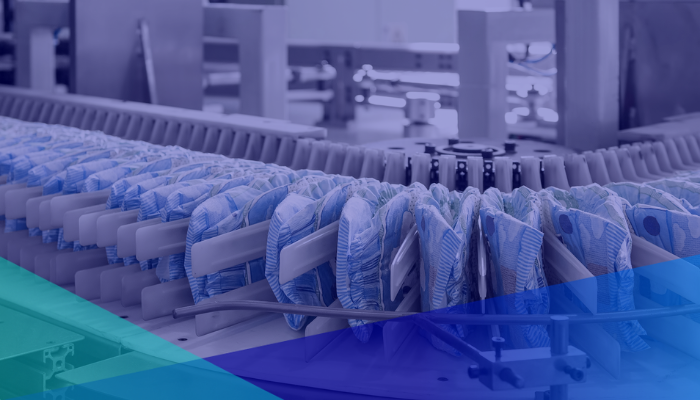
Look at a diaper converting line, which operates at top speed, and the potential for scrap is huge. Hundreds of servo motors drive raw material through the conveyors, roll units, and cutting blades to form and build the finished product. The machines sandwich absorbent layers and moisture barrier layers into a long strip that’s sliced into individual diaper segments, all at an incredible pace.
Cutting dozens of diapers every second, the slicing blades need to be razor sharp to ensure each diaper is perfectly shaped. If the blades become dull or misaligned, they could break, or cause incomplete or inaccurate cutting that will show up in the quality control camera. The resulting substandard product gets flagged as scrap, and pulled from the line, along with potentially thousands of units that were created in the minutes before the error was caught. Each unit needs to be perfect, or it will be scrapped.
Why Scrap is Happening
To pinpoint why scrap is building up, I’ve found it’s crucial to combine operational and mechanical data. Looking at operational data around an inefficiently cutting blade will reveal that scrap is building up but interpreting that operational data requires an experienced technician to identify the specific issue, often through trial and error.
Combining mechanical data, such as vibrations, with information about variations in magnetic signatures and data collected across each servo motor, delivers more precise fault detection. Machine learning models can overlay operational data such as line recipe, speed, velocity and torque command — against actual performance, to begin predicting deterioration in specific components, like cutter blades that dull with use.
At that point, you can prevent scrap buildup before it happens, because you can perform maintenance actions, like replacing the blades or cleaning suction units, much sooner.
This same methodology can be applied to any industrial process. Take, for example, bottling filler/labeler systems. Combining mechanical data from the main drive shaft and supporting pumps, with operational data on pressure, fill rate, and product size gives predictive models the information necessary to predict filling or sealing failures, and reduce the scrap build-up of wasted product that results.
Food packaging operations are also exploring the benefits of combining both mechanical and operational data to reduce scrap. On a frozen pizza packaging line, for example, quality control and product appearance must be strictly maintained. If toppings wind up in the wrong place because the equipment is misaligned, the whole unit gets scrapped. Being able to detect machine issues prior to disruption — instead of dealing with the scrap and efficiency loss that occurs with single-source, lagging indicators — can mean the difference between meeting supply chain demand or falling short, and wasting tasty pizza!
A Bigger Picture Means Better Decisions
Clearly, achieving production efficiency means going beyond simply monitoring machine health through mechanical data, or looking only at the operational data already collected by your PLCs. By tying together mechanical and operational data, operators gain a complete overview of what’s happening on the line at any given moment.
This bigger picture lets technicians determine better maintenance practices and make better decisions—for example, whether it’s better to take the line down for forty-five minutes to change a knife blade, or to continue to run and possibly generate more scrap, but also produce more product.
Regardless of whether a line is producing diapers, beer, or pizzas, I’m now convinced that the process of coupling mechanical data with operational data can help reduce scrap, benefitting production efficiency, as well as the bottom line.


