Augury’s Machine Health platform delivers value fast and at scale. Now Augury’s Overview Dashboard shows you that value at a glance. The upgraded dashboard presents the Machine Health status along with the adoption and impact metrics at and across your sites – including the number of machine improvements, downtime hours avoided and total value of costs avoided.
A Fast-Track to Value at Scale
On June 15, 2021, Augury released its upgraded Overview Dashboard. This aggregated insight tool empowers everyone from the decision-makers in C-Suite to those working on the factory floor to understand the power of AI-driven machine health diagnostics in improving workflow and avoiding unplanned downtime.
“In our business, it’s sometimes hard to see the forest from the trees. So, we need something you can share that can be understood by everyone.”
Our dashboard no longer just drives you to speedy ROI, it shows you that ROI. It gives an overview of both the most successful sites and where there’s still room for improvement. You can then share the best practices to inspire positive – and profitable – change across your organization.
“I know Augury brings value. With these insights side-by-side, I can more easily show the impact – with real numbers on money saved – to others on my team. I can better share the love.”
A Clear Path to Spurring Machine Health Adoption
With a proven track record, Augury’s Halo Machine Health platform has long attracted those looking to:
- Pursue smart manufacturing and industry 4.0
- Eliminate unplanned downtime
- Optimize maintenance scheduling and planning
- Optimize Overall Equipment Efficiency (OEE)
- Achieve M&R cost reduction initiatives
In short, Augury is specialized at listening to machines so they can stay running as efficiently as possible. However, based on our ever-expanding industry expertise and feedback from our clients, we came to realize we could do more in enabling our clients to “spread the word” of the value of machine health – and its remarkably speedy ROI – so it would be widely adopted across an organization.
“If a new site starts slow, easy access to this information will help correct wrong behavior from the start – pointing to the specific best practices of more successful sites. They can then help themselves.”
At the time, the value and success metrics were there but not presented cohesively enough to help drive change. These metrics needed to be more clearly presented to readily convince colleagues that scaling use will equal scaling value.
With this realization, our product team had a clear goal…
Upward and Onward: Scaling Machine Health Value
We are proud of what our product team has achieved through a whole series of platform and process releases. And we are very happy to share the results of their work – at no extra costs to our current and future clients.
“I want to directly see how another site is doing it differently – and better. Our site can then get up to speed much quicker.”
The Overview Dashboard now has the whole organization in mind. As a real-time tool, it can both motivate the technician on the floor with insights from another location, and help corporate level users lay out a roadmap to expanding the value and ROI to other sites – with the momentum driven by actual realized numbers.
“When I show the dashboard to the VPs behind cutting the checks, I want to make them happy by clearly showing the value – and the speed of ROI.”
Adoption and usage success transparency also works to promote identification and scaling of best practices (with associated realized value) across high and low-performing sites.
Three Levels For a Full Picture
The Overview Dashboard now aligns three fundamental levels:
1) Health Status
Our bread and butter… Our intuitive, out-of-the box prescriptive diagnostics reduce the risk of machine downtime and help you optimally plan your maintenance schedule – by informing your maintenance team on what’s wrong and how to best fix it.
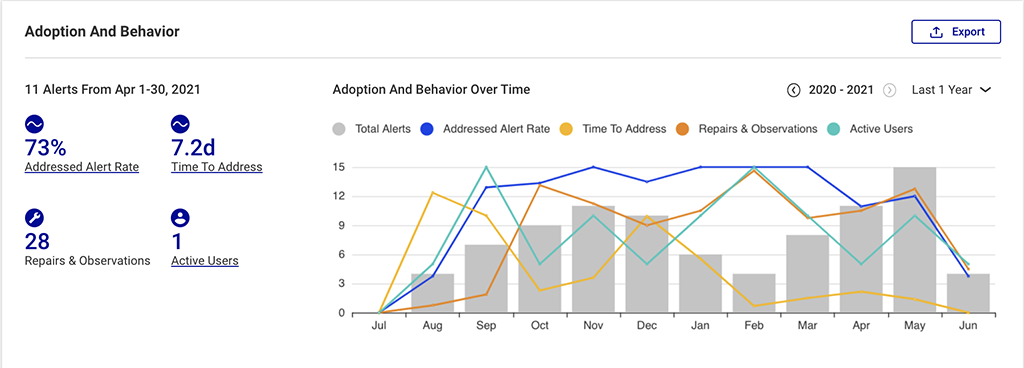
2) Adoption & Behavior
This section ensures that the platform is being used – and used correctly – at and across sites. In this way performance standards are promoted and best practices shared.
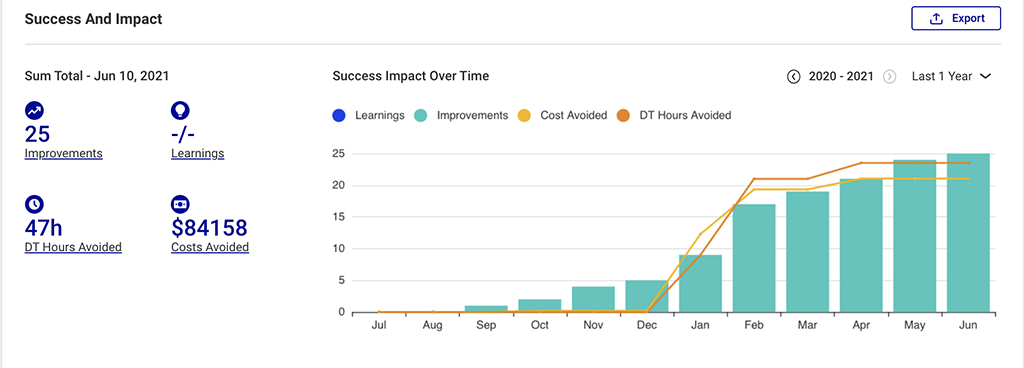
3) Success & Impact
This clearly shows – and shares – the value of your machine health program to drive expansion discussions. What is the actual volume of successes my organization achieved using Augury? And what was the impact of these successes on my organization?
So let’s get started. Enjoy the ride.
How much can Augury save you? Crunch the numbers with our value calculator and discover how much time and money you can save with our proven approach to machine health.
